
In line with the limited existence of a consolidated cartographic product and the budding map issues about the COVID-19 pandemic, this diploma thesis was developed to create a thematic atlas focusing on the direct and indirect impact of the COVID-19 pandemic on society and the environment, employing proper cartographic and design principles.
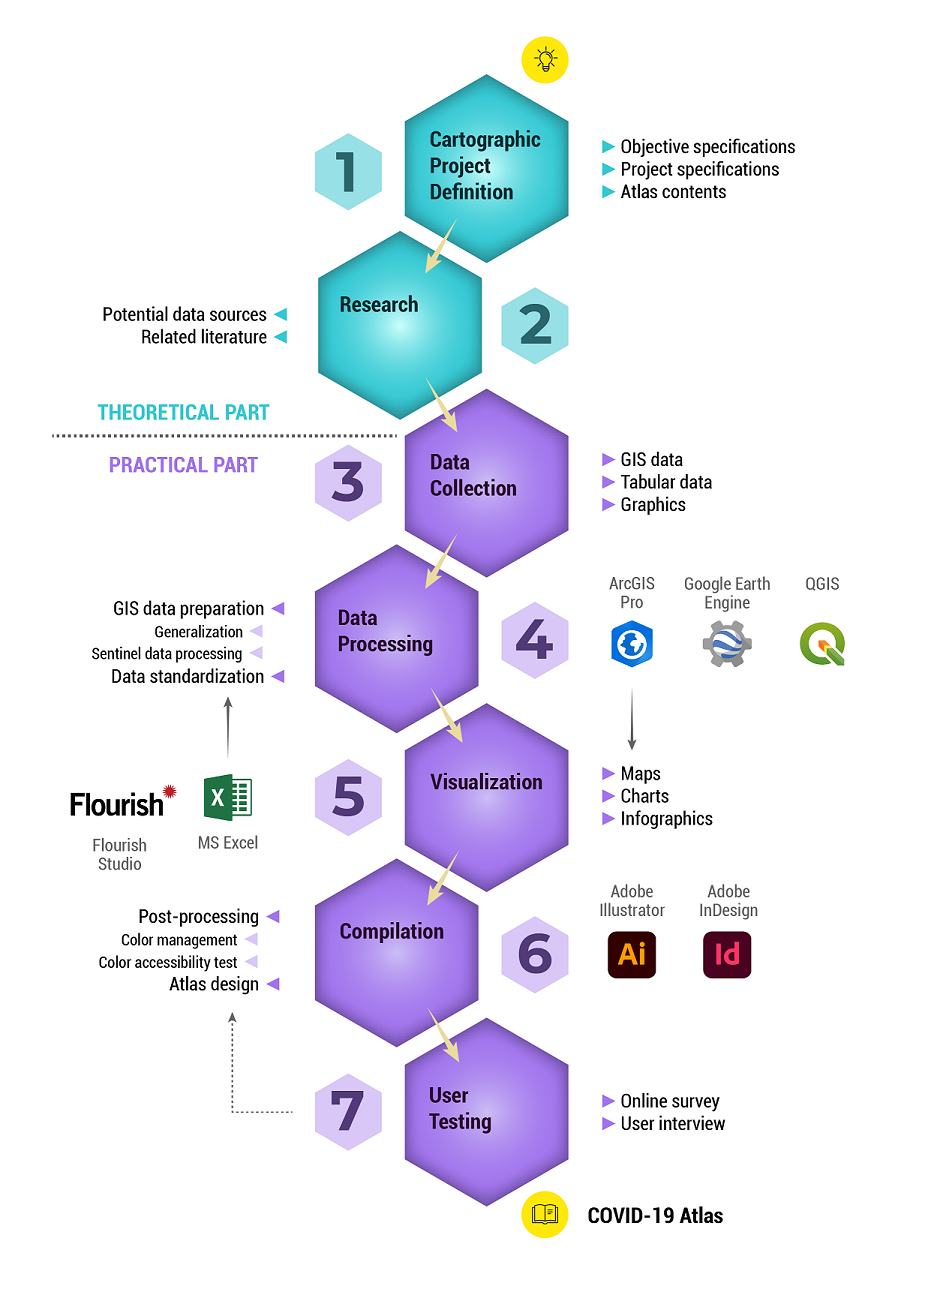
In creating the atlas, a cartographic project definition was formulated first to structure the objective and project specifications. GIS and tabular datasets were then acquired from global data sources to create various types of visualizations such as maps, charts, and infographics. This atlas utilizes data from various authoritative sources for global datasets such as the Johns Hopkins University Coronavirus Resource Center (JHU-CRC), the Oxford COVID-19 Government Response Tracker (OxCGRT), the World Bank (WB), the International Monetary Fund (IMF), and the Copernicus Programme.
The content of the atlas was divided into four main chapters focusing on the current state of the pandemic, its social implications, as well as the indirect impacts on the economy and environment. Before the maps were created, pre-processing and standardization of the data were done using GIS software. Reference maps and several types of thematic maps (e.g. choropleth maps, categorical maps, synthesis maps) were utilized to provide a holistic narrative of the COVID-19 pandemic.
Desktop publishing software was used in the post-processing of the maps and charts. Color accessibility testing was also conducted to ensure that the color schemes used in the atlas are distinguishable even for people with color vision deficiencies. Based on the project specifications, the atlas layout was designed following the principles of graphic design.
A short usability testing was also performed through a survey questionnaire and user interview to assess the interpretability and readability of the atlas. Aside from this, the testing was also conducted to identify which atlas components can be further improved to enhance its overall readability. Upon gathering the results of the user testing, necessary improvements were applied to the atlas design ensuring that map use has been incorporated into the creation of the cartographic product.
The result of the diploma thesis is a printed and digital version of a thematic atlas about COVID-19 and its implications on the social, economic, and environmental aspects. Along with the actual atlas, a streamlined methodology of atlas creation from project definition to pre-press was also defined.
The main goal of this master’s thesis is to generate a cartographic product in the form of a thematic atlas focusing on the direct and indirect impact of the COVID-19 pandemic on society and the environment. Along with the actual atlas, it also aims to outline a streamlined methodology on the creation of a thematic atlas of a global topic from project definition to pre-press. This atlas utilizes data from various authoritative sources for global datasets such as the Johns Hopkins University Coronavirus Resource Center (JHU-CRC), the Oxford COVID-19 Government Response Tracker (OxCGRT), the World Bank (WB), the International Monetary Fund (IMF), and the Copernicus Services.
To realize these goals, the work objectives were divided into theoretical and practical parts. The first part focuses more on research and initial planning while the practical part concentrates on the actual production and evaluation of the atlas and its components.
As the final output of this thesis, the atlas can serve as an easy-to-use source of information in understanding the global impact of the COVID-19 pandemic for general public consumption. While the recentness of information shown has been one of the major limitations of atlases, this COVID-19 atlas focuses mostly on documenting the global conditions one year after the pandemic has started. Given that the pandemic has not been declared over, this atlas can also be used as a basis for the succeeding editions or similar cartographic products in the future. The methodological aspect of the thesis can also be beneficial for cartographers who are concerned with the production of high-volume thematic maps for global topics (e.g. COVID-19 pandemic).
For the completion of this master’s thesis, the initial work was focused on the theoretical part starting with the cartographic project definition. The objective and project specifications were identified and the contents of the atlas were finalized following a consultation with the thesis supervisor. This was followed by preliminary research on the potential data sources as well as on scientific literature about the topic. Important issues focusing on thematic cartography and map design were explored together with the state of atlas creation specifically on global topics.
Due to the broad range of topics included in the atlas, a great deal of time was devoted to data collection and processing. The initial part of data collection was spent on the acquisition of GIS data for the reference map and the environmental topics especially since the datasets for the other topics were still unavailable until the end of January 2021. Once all the necessary datasets were obtained, data processing and harmonization using GIS software were conducted before the actual production of maps and other graphical contents of the atlas.
Map and chart design improvements (e.g. color management, color standardization, etc.) and the designing of the final atlas layout were accomplished using desktop publishing programs (DTP). A short user testing was also performed after the creation of the final atlas to evaluate the usability of the generated cartographic product. Several consultations regarding the map design were conducted together with the thesis supervisors to ensure that the final product will maximize its usability.
In connection with the objectives of this thesis, a thematic atlas visualizing the socioeconomic and environmental impacts of the COVID-19 pandemic was created applying the principles of modern cartography and graphic design. The thematic atlas comprising of 80 maps, 52 charts, and four main infographics provides an integrated source of information in understanding the various aspects of the pandemic besides the usual statistics shown by most maps produced today. This includes social, economic, and environmental aspects covering the topics of containment policies enforced, changes in major economic indicators, and level of pollutants among others. Two types of PDF files were exported for the digital and analog versions of the atlas.
Aside from the actual atlas, a general workflow for atlas creation was also outlined in this thesis. This workflow covers the initial phase of cartographic project definition up to the pre-press stage and user testing. Also, supplementary outputs include the ArcGIS STYLE file and the Adobe color swatch containing the color-blind safe color schemes used in the atlas. A Map Data Visualization Report which contains the symbology specifications used in the maps was also included.
For the user testing, a mix of professionals mostly with non-GIS backgrounds was asked to participate. A total of 25 respondents from various age groups and educational backgrounds answered the survey. There is a good balance in terms of the sex of respondents but the majority of them came from the 25–35 age group, or the young professionals. Aside from the age group, the educational backgrounds of these respondents also reflect the target audience which is composed of those with bachelor's and master’s degrees.
The results of the usability testing were gauged to see also which map and page elements need to be further improved. This has been deemed useful in improving the interpretability of the visualizations and the quality of the atlas in general. Considering that this is the first interaction of the atlas and the user, the performance by the respondents indicates that the atlas is a viable mode of presenting information about the COVID-19 pandemic, although a more robust form of user testing can still be employed in the future to support this. Ultimately, involving the potential map users in the creation process not only provides a holistic approach to map production but most importantly, helps improve the quality of the resulting cartographic work.